Objectives
After studying this module, you should be able to:
- enumerate the four major paradigms through which the problem of underdevelopment is analyzed; and
- determine the subordinate and superordinate influential factors of the underdevelopment problematique from each major paradigm.
Activities
Read the Prologue and Chapter 1 of your textbook, Introduction to Development Communication. Perform the following activities:
- Activity 1.1. Determine the unemployment rates of the past ten years from the National Economic and Development Authority sources. Plot the rates on a two-dimensional plane with the x-axis representing the years. Connect the points with a line. Is the unemployment rate increasing or decreasing?
- Activity 1.2. Listed below are three societal problems that require statistics and necessitate yearly updates. For each of these problems associated with underdevelopment, research the figures for the past ten years. Draft three graphs like the one you drew in Exercise 1 for unemployment. Please make sure to cite your references.
Activities
Activity 1.1 | Unemployment Rate

Here is the line plot showing the Philippines’ Annual Unemployment Rate from 2015 to 2024 based on the table data. The chart clearly highlights the sharp rise and subsequent recovery from the 2020 peak.
Analysis of the Trend
The plot demonstrates a general downward trend in unemployment rates from 2014 to 2019, reflecting an improving job market. The most notable features are:
- COVID-19 Impact: A massive surge in 2020 to 10.3%, coinciding with the beginning of the COVID-19 pandemic.
- Post-Pandemic Recovery: A strong recovery over the next few years, bringing the rate down substantially to a projected 3.9% in 2025. This projected figure is the lowest in the entire 2015–2024 series.
Activity 1.2 | Other three (3) Society Problems
The performance of Philippine food production, measured by the growth rate of the Gross Value Added (GVA) in Agriculture, Forestry, and Fishing (AFF), has been highly erratic over the last ten years.
“Low Food Production” is indicated by years of slow or negative growth rates, which are generally attributed to severe weather disturbances (e.g., typhoons, El Niño), animal disease outbreaks (e.g., African Swine Fever), and persistent structural issues in the sector.
Here is the annual growth rate (at constant prices) for the Philippine Agriculture, Forestry, and Fishing sector from 2015 to 2024 (10 years):
Low Food Production
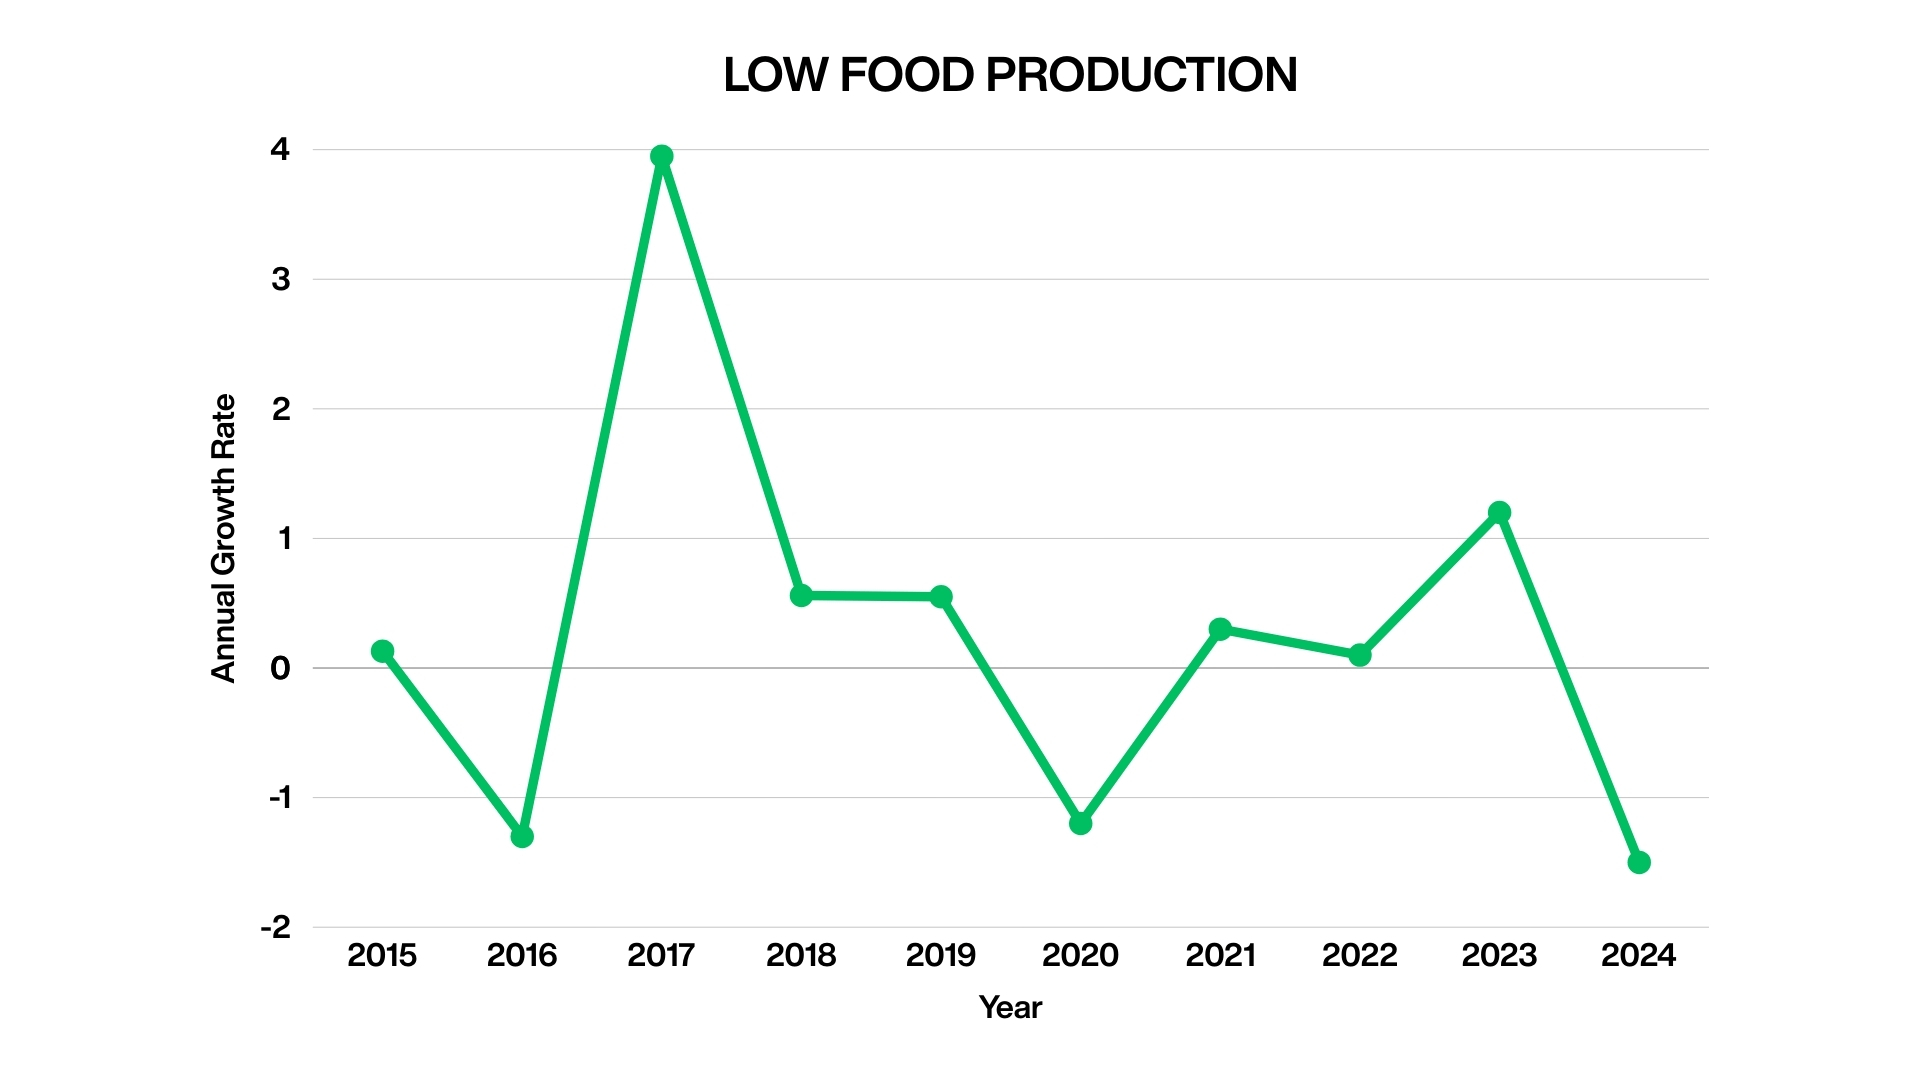
The plot showing the Annual Growth Rate of Philippine Agriculture, Forestry, and Fishing (2015–2024).
The line chart visually shows the sector’s highly volatile performance, with growth rates frequently hovering near zero or dipping into contraction (below the red zero line). The highest growth was in 2017 (3.95%), and the most significant contraction was in 2024 (-1.5%).
Key Figures and Trends
- Negative/Contraction Years: The sector registered negative growth (indicating a decline in food production) in 2016, 2020, and 2024, each tied to major crises (El Niño, Pandemic/ASF, and El Niño, respectively).
- Average Growth Rate: The average annual growth rate for the entire period (2014-2024) is approximately 0.67%, which is low and points to the sector’s long-term struggle with productivity and resilience.
- Subsector Volatility (Illustrative Example): The Crops subsector, which is the largest component of AFF, had a particularly steep decline in GVA of 3.7% in 2024, reversing the previous year’s growth. This kind of volatility highlights the instability of food production.
Sources:
- Philippine Statistics Authority (PSA)
- World Bank, Philippines – Agriculture, Value Added (annual % Growth)
- Philippine Institute for Development Studies (PIDS) and other economic reports citing PSA data.
Note: Data for 2024 may be preliminary or a World Bank estimate as of the time of the search, while all other figures are based on historical PSA data for Gross Value Added (GVA) at constant prices.
Illiteracy Rate
The official and most detailed literacy and illiteracy data for the Philippines comes from the Functional Literacy, Education, and Mass Media Survey (FLEMMS) conducted by the Philippine Statistics Authority (PSA). This survey is typically conducted every 5 to 6 years, not annually.
Therefore, an annual, consistent 10-year illiteracy table (2015-2024) does not officially exist with the Philippine government.
However, based on the closest available official data and the goal of representing the trend, we can use the following historical data points for the Basic Illiteracy Rate (the percentage of the population who cannot read and write a simple message).

The plot shows the Philippine Illiteracy Rate (2015–2024).
The chart illustrates two key periods:
- 2015-2019 (Stable, Low Illiteracy): The line is flat at 4.0%. This reflects the high historical Basic Literacy Rate (96.0%) based on the simpler definition (ability to read and write a simple message).
- 2019-2024 (Sharp Increase): The line shows a significant and sharp upward jump, ending at 10.0% in 2024. This increase is primarily due to the Philippine Statistics Authority’s adoption of a new, more stringent definition for Basic Literacy in the 2024 FLEMMS, which now includes the requirement to comprehend and compute.
Data Sources and References
- Basic Illiteracy Rate: Sourced from estimates published by the World Bank (WB) and the UNESCO Institute for Statistics (UIS), based on the standard international definition of literacy (ages 15+).
- Functional Illiteracy Rate: Sourced from the Philippine Statistics Authority (PSA), specifically the Functional Literacy, Education, and Mass Media Survey (FLEMMS). These figures are only available for the survey years (2015, 2019, 2024).
- FLEMMS 2024: Philippine Statistics Authority, 2024 Functional Literacy, Education and Mass Media Survey (FLEMMS) Final Results.
- Annual Gaps: Years without an official PSA FLEMMS survey are filled with international estimates, as the PSA does not produce annual national literacy figures.
Spiraling National Debt

The plot shows the Philippine Outstanding National Government Debt (2015–2024).
The line chart clearly demonstrates the rapid increase in the Philippines’ debt, particularly the steep rise starting in 2020.
Key Visual Takeaways:
- Steep Upward Trajectory: All three lines (Total, Domestic, and External Debt) show a distinct and sustained upward trend over the decade.
- The COVID-19 Jump (2019-2020): The slope for the Total Outstanding NG Debt line becomes dramatically steeper after 2019, reflecting the massive increase in borrowing to fund the government’s response to the pandemic.
- Debt Composition: The Domestic Debt line remains consistently above the External Debt line, confirming that the government primarily relies on local borrowing. The gap between Domestic and External Debt has widened in absolute terms over the period.
The Total Outstanding NG Debt line (the thickest, darkest line) is the sum of the other two lines and shows the country’s overall debt burden reaching over $16 trillion by the end of 2024.